Risk Explorer - User Guide and Introductory FAQs
These pages provide a step-by-step guide to running the Risk Explorer tool and give more general background on the tool’s uses and limitations.
What is the Oasis Risk Explorer?
The Oasis Risk Explorer is a tool developed by the Insurance Development Forum in partnership with Oasis and Maximum Information. The central purpose of this tool is educational, serving as an introduction to the different considerations that go into modelling catastrophe risk with specific applications to parametric insurance. The tool aims to guide users through the different elements that need to be considered when modelling catastrophe risk. Each of these elements is broken out into separate tabs that form the basic building blocks of the model.

Risk Explorer Toolbar Displaying the Application’s Different Tabs
The first three sections (excluding the introduction) require inputs from the user that define how the risk will be modelled:
Exposure: Which location or area are you interested in modelling?
Hazard: What type of events (e.g., windstorms/earthquakes etc.) are you modelling and what data should be used to model them?
Vulnerability: How will the physical events in the model lead to damage and financial loss?
The next three sections allow the user to run modelling and view outputs from their modelling:
Simulation: Once hazard, exposure and vulnerability are specified, this is where you can run simulation modelling.
Event Analysis: Once your simulations are complete, this tab will allow you to examine the model’s output in more detail. The main goal of this tab is to give a better sense of the type of events that occur in the simulations.
Loss Analysis: Once your simulations are complete, this tab will allow you to analyse the financial losses that flow from your modelling. You can also export Excel files here for further analysis.
What regions and perils can the tool model?
The Risk Explorer is able to model tropical cyclone worldwide using IBTrACS Historical data. The map below shows the different basins covered by the tool:
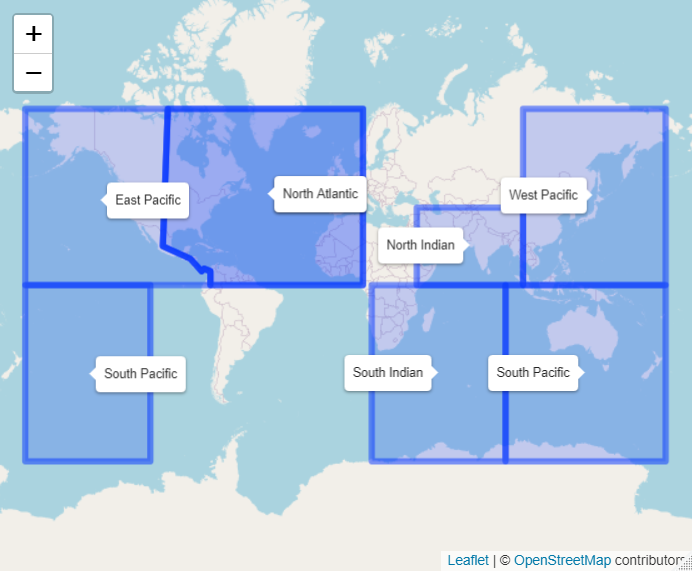
Tropical Cyclone Basins
Note these boundaries are somewhat arbitrary, however this should give you a rough idea of which areas you would expect to see tropical cyclone activity in. The model also uses stochastic hazard data from vendors giving coverage for a number of regions for tropical cyclone and earthquake. Note the red areas on the map denote earthquake coverage, and the blue ones denote cyclone coverage
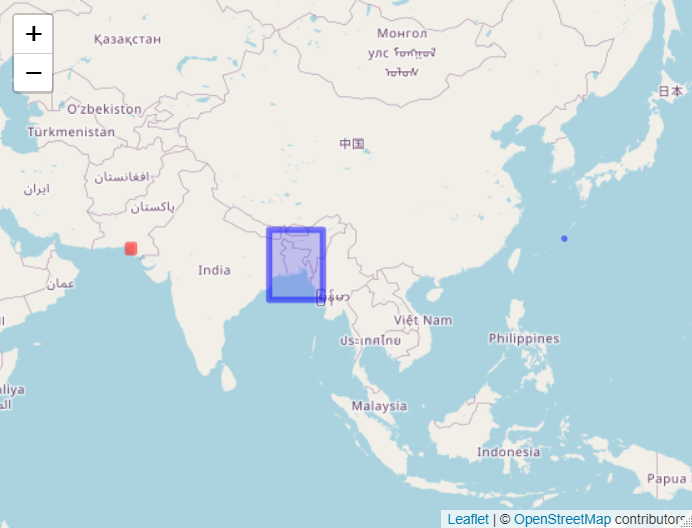
Tropical Cyclone Coverage for Stochastic Hazard Data The stochastic hazard datasets available and relevant vendors are: * Earthquake Pakistan (Karachi) – Aon Impact Forecasting * Tropical Cylone Japan (Ginoza Region) – Aon Impact Forecasting * Tropical Cylone Bangladesh – Oasis
What is parametric insurance?
The Oasis Risk Explorer is an educational tool that enables you to model simple parametric covers using the vulnerability tab. Parametric insurance covers are attractive to a wide range of customers due to their simplicity and the speed with which pay-outs can be calculated and distributed to policyholders compared to standard insurance covers. Parametric insurance pays out a pre-agreed amount when a certain type of event occurs in a given location or area. The amount paid to the policyholder will often be specified in “steps” determined by the magnitude or intensity of the event in question. The example below gives a simplified demonstration of how a cover might work.
Example
A parametric insurance product is purchased by a local authority or national government to cover windstorm damage in a town that is prone to typhoons. The local government have some idea of the economic cost of these types of events from previous typhoons that have hit the town in the past. They decide that they want coverage for events that are at least of category 2 strength on the Saffir-Simpson scale, as recent events have demonstrated that this is generally where the cost of such events becomes higher than the government can cover from their national reserves. They also want the cover to protect them from more extreme events, up to the worst event that is likely to occur in a 50-year time period. They estimate that a category 4 typhoon impacts their town roughly every 50 years, so decide to purchase cover that will be enough to reimburse them for the likely damage from this. They decide based on their budget and their knowledge of previous events to purchase parametric insurance that:
Covers an area of 5km radius around the centre of the town
Triggers based on wind speed
Has a maximum payout amount of $10m
With these priorities in mind, they select the following payout terms:
Wind Speed |
Pay-out |
|---|---|
154km/h (category 2) |
50% of maximum ($5m) |
178km/h (category 3) |
75% of maximum ($7.5m) |
209km/h (category 4) |
100% of maximum ($10m) |
In this example, if a wind speed greater than 154km/h but less than 178km/h is recorded within a 5km radius of the town, the local authority would receive $5m in pay-out. Similarly, if a wind speed of 180km/h was recorded, they would receive a pay-out of $7.5m. Any wind speed recorded above 209km/h would result in the maximum payout amount of $10m. This type of payout structure is replicated by the “step” vulnerability curve in the Risk Explorer.
How should this model be used?
As mentioned previously, the main use of this model is as an educational tool. The way that you use this app will depend on the background knowledge you already have of risk modelling and parametric insurance. If you have no in-depth prior knowledge of the area, it is suggested that you go through the Risk Explorer in the following steps:
Step 1: Get familiar with each tab’s purpose and try to produce outputs (any outputs!). Go through each tab with these help pages open and try to understand the purpose of each section and input. E.g., why do we need to specify an exposure? Why would we want to specify an area rather than a single location? Working your way through each tab, try and get the model to produce results on the event and loss analysis tabs. Examine the outputs and try and get some idea of what they are showing and why they might have been included. You may wish to start by using stochastic hazard data, as the outputs are a bit easier to understand. Once you have run this, move on to using IBTrACS data.
Step 2: Purposefully change certain inputs in each tab and see what impact these have on expected payout and other outputs. This will help you to understand potential variability in the output. This process should also give you an idea of the careful choices required in modelling risk and structuring insurance covers that will provide cost-effective resilience. Some ideas of inputs you could experiment with changing would be:
Location (on the Exposure tab) E.g., moving your location 20km to the north?
Area around your Location (Exposure) E.g., modelling a single location vs 50km radius?
Asset Value (Exposure) E.g., doubling your asset value?
Meteorological Agency (Hazard) E.g., For IBTrACS data, using Japanese meteorological data vs Chinese data for the West Pacific basin?
Intensity Measure (Vulnerability) E.g., using a pressure intensity measure rather than wind speed?
Number of Steps in your Vulnerability (Vulnerability) E.g., looking at a curve with increases in damage for cat 1,3 and 5 wind speeds rather than for all categories?
Intensity Measure Values at each Level in your Vulnerability Curve (Vulnerability) E.g., adding 10km/h to the wind speed for each of your intensity values.
Damage Percentages at each Intensity Level (Vulnerability) E.g., increasing or decreasing your damage at lower or higher intensity measures.
Shape of your Vulnerability Curve (Vulnerability) E.g., Using a linear vulnerability curve compared to a stepped curve?
Number of Simulations (Simulation) E.g., Running 5,000 simulations rather than 2,000?
When you change each of these aspects, examine the outputs and think about whether the difference is what you would expect it to be. Also consider the reasons why it is likely to be different. Some examples of outputs to look at would be:
Expected Loss for each Method: For IBTrACS hazard data, what is the impact on the historical, unweighted and weighted simulation losses and how do they compare to each other?
Standard Deviation: How does the standard deviation compare to the expected loss? For IBTrACS hazard data, what is the impact on the average historical, unweighted and weighted simulation standard deviations and how do they compare to each other?
Distribution of Losses for each Simulation: How has the shape of the overall loss distribution changed? You may want to pay particular attention to the extreme right of the distribution as this is where the most severe outcomes occur.
Return Periods of each Category of Storm: How common is each category of storm or earthquake? How big is the gap between the simulated output and the history?
Simulation Output Do some basic analysis on the csv files using spreadsheet software. Do you notice any trends or patterns?
Step 3: Speculative cover design and loss modelling. While this tool does have the functionality to allow for basic modelling and design of insurance covers, this is not its primary use. If you do intend to use the model in this way, it is very important that you have a solid grasp of the model’s limitations and methodology. Even then, you should exercise a very high degree of caution when using the tool for any kind of decision-making.
Some examples where the Risk Explorer could be run and prove helpful in a real insurance modelling setting might be:
Modelling parametric covers in under-served regions with no commercial models available. There may not be any commercially available tools for some regions that sit outside of the main insurance markets. In this case the Risk Explorer may be helpful for gauging some idea of potentially reasonable pricing for the cover.
Sense-check for an existing commercial model. It may be useful to have an alternative view to whichever other models are being used, especially given the transparent assumptions in the Risk Explorer.
One of the reasons to be careful when using this for real-world covers is that the market prices you would likely be able to buy the insurance cover at will differ a lot from the average losses the tool produces. In practice, insurers need to cover expenses, uncertainty risk and profit margins in the prices they charge.
Prices will also be impacted by market conditions such as the competitive environment and appetite amongst insurers for writing these types of covers. As such, unless insurers have a much lower view of the underlying expected loss, it is likely that real market prices for any covers priced in the tool will be higher than the average losses generated here.