Oasis UI
On this page:
Introduction
The Oasis User Interface (UI) is a web-browser application and is the front-end of the Oasis framework. It enables a user to import their exposure and financial data before executing a cat model. The results produced by the model are based on the user-defined outputs, which are extensively customisable, catering for most user requirements. The UI is simple and intuitive to use, and demonstration videos can be found below. There is an extended training video with voice instructions and a shorter “bitesize” version capturing the major components of the process.
The UI was designed primarily for model evaluations and to perform testing, rather than for core in/reinsurer portfolio rollups.
UI Demo Video - Walkthrough
UI Demo Video - bitesize
Risk metrics
The Oasis UI enables the user to generate multiple output reports for several summary levels and perspectives in a single run. The Oasis kernel is a Monte-Carlo simulation that randomly samples the loss distribution. The number of samples is defined by the user and the level of convergence achieved across that sample set will vary depending on the model, portfolio, and as the required outputs.
- There are two types of statistical outputs that can be delivered in the reports:
Numerically integrated – meaning the loss statistic is calculated directly from the underlying probability distribution of loss.
Sample statistic – meaning the probability distributions of loss are sampled many times and the loss statistic is calculated from that set of samples.
- The list of available reports are as follows:
Sampled losses
Average annual loss and standard deviation
Event loss tables
Period loss tables
Single loss exceedance curve (AEP/OEP)
Multiple loss exceedance curve (AEP/OEP)
- By summary levels:
Location
Line of business
County
State
Programme (whole portfolio)
Policy (insured loss only)
- By Perspective:
Ground up
Insured loss
Open Results Data (ORD) tables can be selected and exported from the UI. More details of ORD can be found here
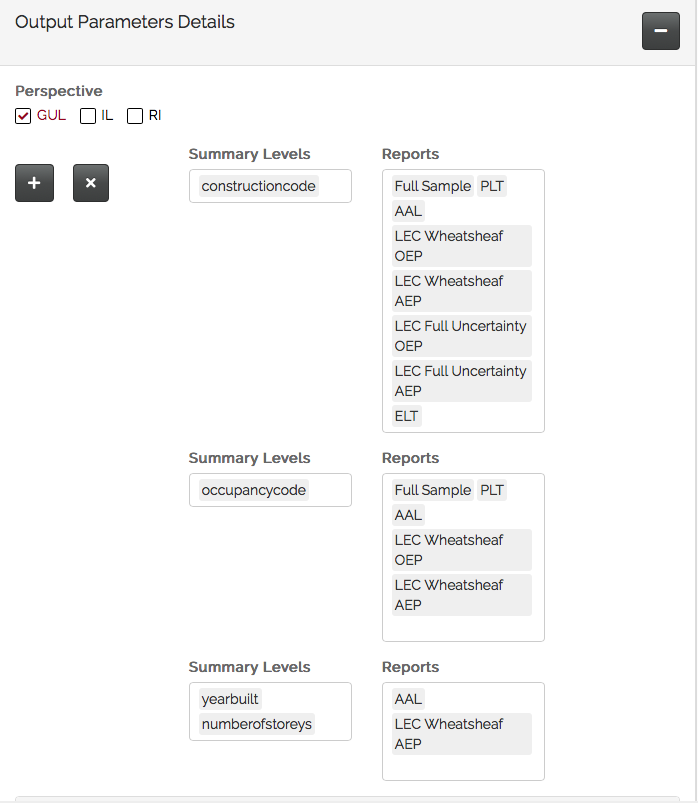
Output Reports
The user can generate an extensive suite of output reports for any exposure attribute, multiple summary levels and financial perspectives directly from the UI.
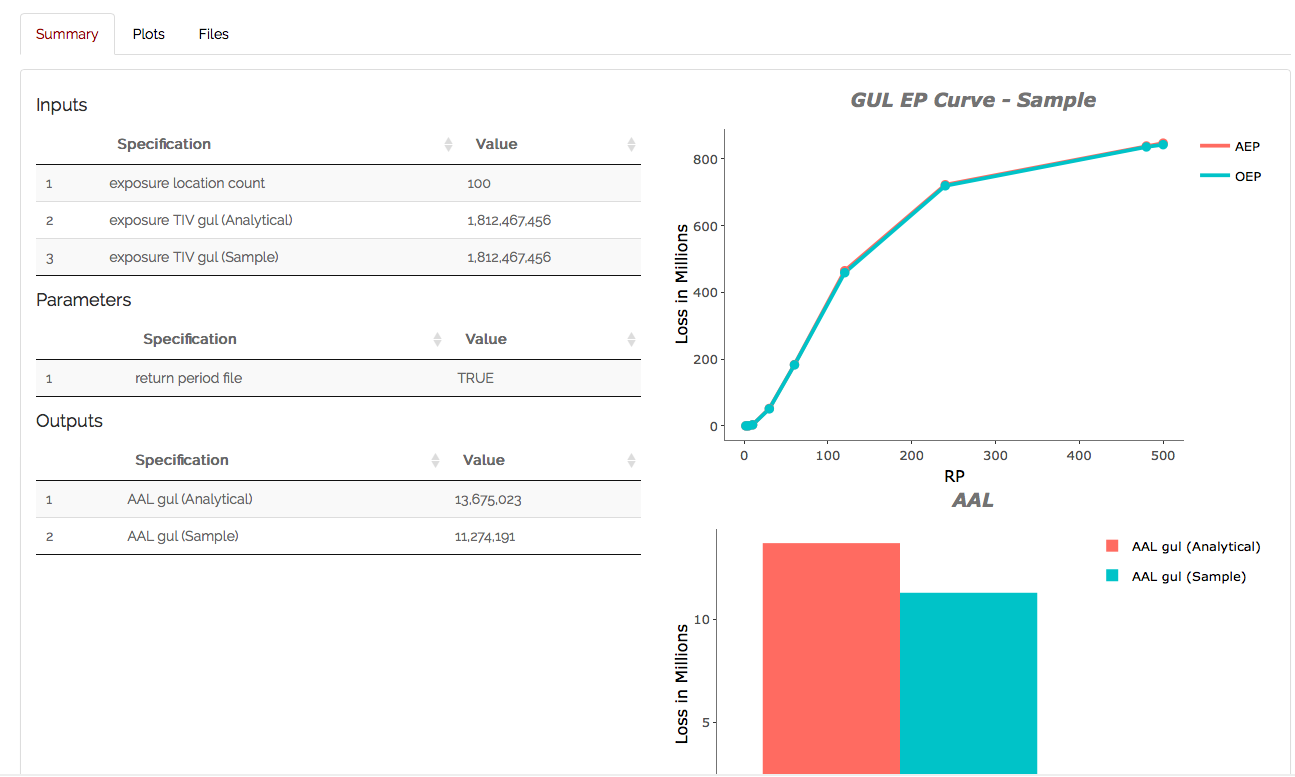
Customising Plots
The user can customise their own result plots in the UI and export them for reporting purposes:
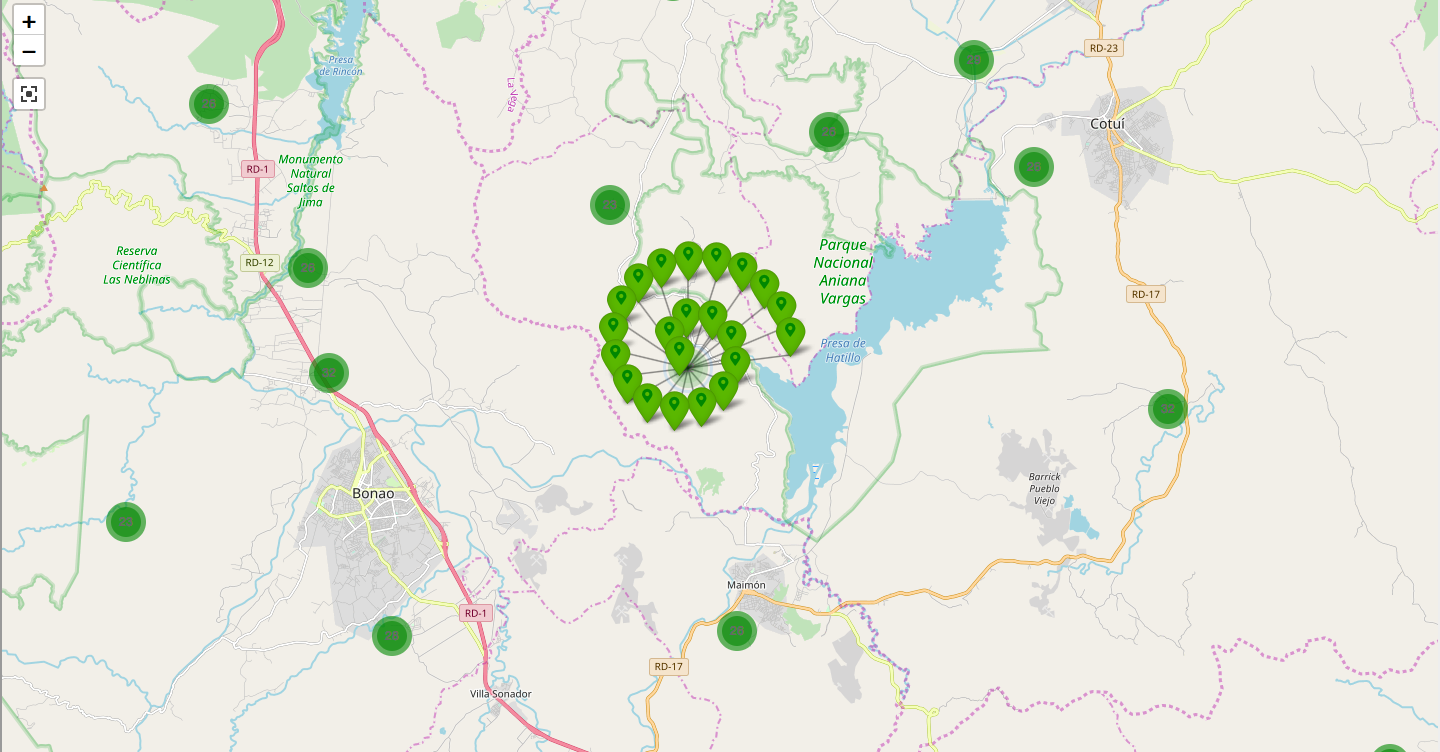
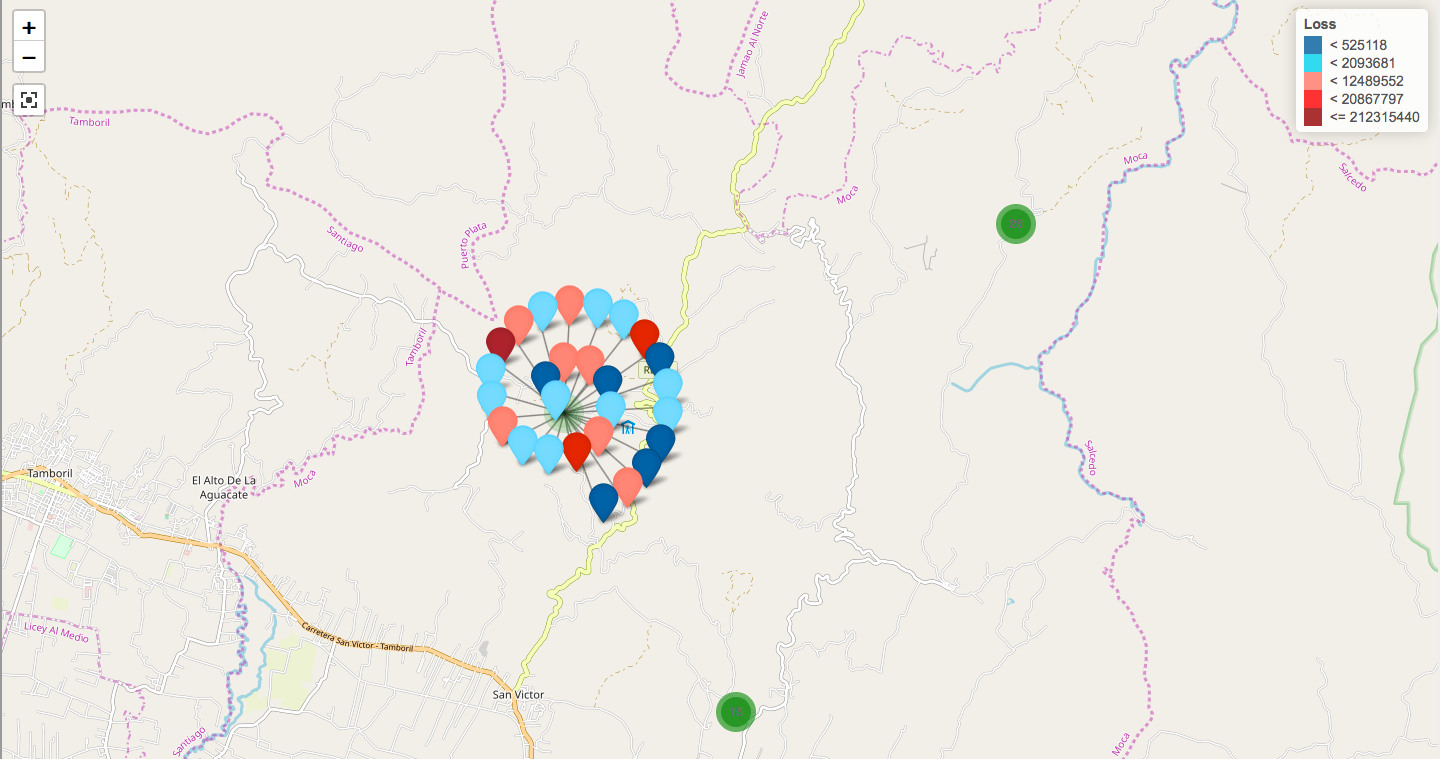
Exposure and Loss Maps
Risk level exposure and losses can be visualised on a map as shown below:
GitHub repository
More information about the Oasis UI can be found in the GitHub repository.