Distributed Execution and Scaling
Overview | Platform Architecture | Container Configuration | The Oasis REST API | Distributed Execution and Scaling | Configuration for Distribution and Scaling
This section details the two primary execution modes – ‘Single Server’ (run_mode = v1) and ‘Distributed’ (run_mode = v2) – for our software’s core workflows. Both modes consistently involve two distinct stages: ‘file preparation’ and ‘losses generation’. The fundamental difference between these modes lies in the sophisticated orchestration of tasks using Celery.
Single Server Execution (run_mode = v1)
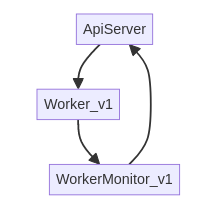
In ‘Single Server’ execution, the system operates akin to a monolithic application, with each major workflow stage encapsulated within a single, self-contained Celery task. This mode mirrors the direct invocation of OasisLMF command-line interface (CLI) commands, such as $ oasislmf model generate-oasis-files for file preparation and $ oasislmf model generate-losses for losses generation. The execution occurs within the isolated Python environment provided by the ‘model worker’ Docker image.
Celery Task Flow
Each of these large-grained tasks is dispatched from the central server. A single ‘model worker’ container then picks up the task, processes it to completion, and subsequently reports its results back to the system via the ‘WorkerMonitor’ container.
Internal Parallelization for Losses Generation
While the overall Celery task for losses generation is singular, significant parallelization is achieved internally within this task. This is managed by a bash script, run_ktools.sh, which orchestrates the execution of OasisLMF’s ktools (Kernel Tools).
By default, run_ktools.sh uses all the available compute resource by creating an “in-memory” losses data pipe for each core on the executing system. This approach maximizes CPU utilization for the computationally intensive loss calculations. The parallelization pattern follows a common design:
eve <event batch> <total batches> | <group up loss calculation> | <financial modules>
Here’s a breakdown of the components:
eve <event batch> <total batches>: The eve command is responsible for distributing the event data into total batches, with each instance processing a specific event batch.
<group up loss calculation> (GUL - Ground Up Loss): This stage performs the initial, loss calculations based on the model.
<financial modules> (FM): This final stage applies financial terms and conditions to the calculated ground-up losses to calculate the final insurable losses.
Example: 8-Core System Utilization
Consider a system with 8 available CPU cores. The run_ktools.sh script will dynamically generate a series of parallel pipelines, effectively loading each core to its full capacity.
eve 1  8 | <gul> | <fm>
eve 2  8 | <gul> | <fm>
...
eve 8  8 | <gul> | <fm>
In this ‘Single Server’ mode, due to its internal strategy of loading every core, the assigned ‘model worker’ can only process a single job at a time. This ensures maximum throughput for that specific job but limits concurrent execution of other, independent jobs on the same worker instance.
Parallel Execution of Multiple Single Server Jobs
While a single ‘Single Server Execution’ job itself fully utilizes one worker, it is possible to run multiple such jobs in parallel. This is achieved by deploying multiple ‘model worker’ pods or nodes, each dedicated to a single execution. To ensure optimal isolation and resource allocation, a 1:1 affinity (default) is typically configured between each node or VM and a worker pod. This means that for every parallel execution initiated, a distinct worker container will be spun up to handle it.
The number of workers available on the v1 worker queue can be scaled in two primary ways to accommodate concurrent ‘Single Server Executions’:
Fixed Scaling: The worker fleet can be provisioned to a fixed number of instances, allowing for a predetermined level of concurrent processing.
Dynamic Scaling (Based on Queued Tasks): For more elastic environments, the worker count can be dynamically adjusted based on the number of pending tasks in the
v1queue. This ensures that resources are scaled up when demand is high and scaled down when tasks are complete, optimizing resource utilization.
Distributed and Scalable Workflows (run_mode = v2)
The ‘Distributed’ execution mode (run_mode = v2) represents our system’s highly scalable approach to processing. Unlike the ‘Single Server’ mode, the core workflows (file preparation and losses generation) are no longer treated as monolithic tasks. Instead, they are decomposed into a collection of sub-tasks, orchestrated by Celery’s canvas primitives into a single chain. These sub-tasks execute sequentially, defining the overall flow of the analysis.
Celery Canvas for Distributed Workflows
Part of the chain is a ‘distributed section’. Within it, multiple sub-tasks, each representing an ‘analysis chunk’, are processed concurrently across multiple worker nodes. This is intentionally designed to be the phase where the bulk of the computationally intensive work is performed, significantly reducing overall execution time compared to a sequential approach.
Chunking for Parallelism (chunks)
The degree of parallelization within a distributed analysis is determined by the number of ‘chunks’. Each ‘chunk’ corresponds to a distinct sub-task that can be processed in parallel. This chunks value is a configurable variable set before the Celery workflow (the chain of sub-tasks) is placed onto the queue.
The chunks value can be determined in a few ways:
Fixed Integer: Directly specified as a static integer, providing a predictable level of parallelism.
Dynamic Scaling based on Input Size: The number of chunks can be dynamically scaled based on the size of the input data. For ‘file preparation’, this is the size of the location file. For ‘losses generation’, it’s the size of an event set.
It’s crucial to understand that this chunks value, which defines the internal parallelism of an analysis, is distinct from the scaling value that controls the total number of ‘model workers’ available on the queue to process these sub-tasks.
Distinction from OasisLMF MDK
The distributed workflow (run_mode = v2) does not have a direct, equivalent command in the standard OasisLMF Model Development Kit (MDK). This is because the fundamental principles of splitting, distributing, and aggregating analyses are intrinsically handled by Celery, which are external to the core oasislmf package. The intelligence for managing this distributed execution resides within OasisPlatform components, such as the TaskController.
However, within each individual sub-task of the v2 workflow, the same or similar functions from the MDK are called. These functions are simply invoked in more atomic, focused steps suitable for distributed processing. As a result, when provided with the same exposure inputs, the final outputs from a v1 (Single Server) run and a v2 (Distributed) run will be identical, guaranteeing consistency across execution modes.
Workflow Submission and Execution Flow
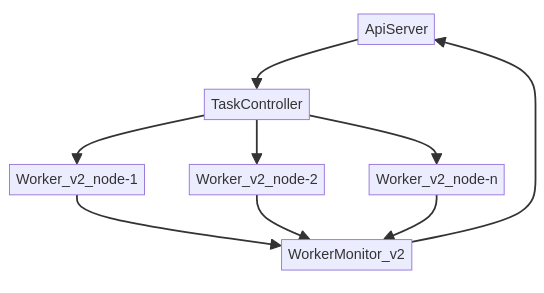
Request Submission: When an execution request for a v2 workflow is submitted, it is received by the API server.
TaskController Orchestration: The API server then invokes the TaskController. The TaskController is responsible for:
Reading the analysis chunking configuration (i.e., how many chunks the analysis should be split into).
Setting the priority level for the execution.
Constructing the complete Celery chain of sub-tasks, which includes the chord for the distributed section.
Placing all these sub-tasks onto the designated ‘model worker’ queue simultaneously.
Dynamic Worker Scaling: Concurrently, a WebSocket update is sent to the WorkerController. Based on the configured scaling parameters for the ‘model queue’, the WorkerController dynamically spins up or scales down the number of ‘model workers’ to match the demand created by the queued sub-tasks.
Task execution: Workers will sequentially process the sub-tasks in the chain until they encounter the parallel (chord) section. At this point, multiple workers will simultaneously process different ‘analysis chunk’ sub-tasks.
Result Aggregation: Once all the individual ‘analysis chunk’ sub-tasks within the parallel section have completed, the chord’s callback task is executed by a single worker. This task is responsible for gathering all the partial results.
For file preparation, this involves generating the final Oasis files with the model lookup results aggregated.
For losses generation, this involves aggregating the distributed loss outputs to generate comprehensive loss reports based on the requested output settings.
Output Collection: Similar to the v1 mode, these aggregated outputs are then collected and stored by a single ‘WorkerMonitor’ instance, which reports the final status and results back to the API server.
Worker maximum concurrent jobs
Each ‘model worker’ instance has a configurable maximum job concurrency value. By default, this is set to the number of CPU cores available on the underlying node. This can be overridden using the environment variable OASIS_CELERY_CONCURRENCY=<int-max-parallel-tasks>
Ensuring Sub-Task Repeatability and Resilience
In a highly distributed environment, there is no guarantee of which specific worker node a sub-task will be executed on. When multiple ‘model workers’ are available, the next available ‘concurrent processing slot’ on any worker will pick up and process a task. To ensure the robustness and correctness of the workflow, especially when dealing with transient failures or dynamic worker pools, our system incorporates two key mechanisms:
Celery Parameter Passing (State Management): Celery’s result backend stores the workflow’s state. Any parameters produced or altered by a preceding task in the chain are automatically stored by the Celery results backend. This ensures that when the next task(s) in the chain are executed—even if on a different worker or after a retry—they have immediate access to the necessary inputs from the preceding steps.
Results Caching (Intermediate File Storage): Some sub-tasks, particularly those in the parallel
chunks, produce intermediate result files. These files are essential inputs for subsequent tasks later in the chain, especially the aggregation (callback) task of thechord. To ensure these files are universally accessible regardless of which worker node processed a specific chunk or which node will perform the aggregation, these intermediate results are stored in a shared storage medium accessible to all workers. This shared storage can be configured as:Network Share (e.g., NFS): A common file system mounted across all worker nodes.
Object Storage (e.g., AWS S3, Azure Blob Storage): Cloud-based storage services.
The output of each parallel chunk is stored with a unique, traceable reference:
Generate Files (Lookup Results):
{worker-shared-storage}/analysis-{analysis_id}_files-{run_uuid}/lookup-{chunk_number}.tar.gzGenerate Losses (Work Files):
{worker-shared-storage}/analysis-{analysis_id}_losses-{run_uuid}/work-{chunk_number}.tar.gz
This persistent storage ensures that even if a worker fails and a task needs to be retried on a different worker (e.g., a
collect-keystask failing on Worker 1 and retrying on Worker 5), the new worker will have access to all the same necessary inputs and previously generated intermediate results. This is critical because the new worker pod might be a completely fresh virtual machine instance.By default, these temporary intermediate files are removed by the final cleanup task in the workflow chain, typically prefixed with
cleanup-. However, for debugging purposes, an environment variableOASIS_KEEP_REMOTE_DATA=Truecan be set to retain these files for inspection.
Optimizing Throughput
Within the generate-losses-chunk sub-task (part of the parallel section for losses generation), each chunk processes a single ktools data pipe:
eve <analysis chunk num> <total chunks> | <group up loss calculation> | <financial modules>
This is identical to the pipes called by the ‘single server’ bash script, only now its encapsulated in a single sub-task per core. This lines up with the one core per concurrent task that a celery worker can execute.
So to achieve optimal overall throughput, the number of parallel ‘chunks’ should be matched to the total computational capacity available across all active ‘model workers’.
For instance, consider a scenario with:
4 ‘model worker’ nodes are available for a single analyses
Each node configured to use 8 CPU cores (either physically or limited to less via
OASIS_CELERY_CONCURRENCY=8)
In this case, the total available cores for concurrent processing is 4 workers×8 cores/worker=32 cores. To fully load all four workers and maximize computational efficiency, the chunk size for the analysis should be set to 32. This ensures that each available core is actively engaged in processing an ‘analysis chunk’, leading to the fastest possible completion of the distributed workload.
Limits of Distributed Speedup: Amdahl’s Law
While distributed computing offers immense potential for speedup, it has limitations, often described by Amdahl’s Law. This principle states that the maximum theoretical speedup of a program when parallelized is limited by the fraction of the program that cannot be parallelized (its sequential component). Even with an infinite number of processors, the overall execution time will always be constrained by this sequential portion.
The impact of this law varies significantly across different Oasis models and workflow stages:
1. File Preparation (e.g., generate-oasis-files): For many Oasis models, the ‘file preparation’ stage, particularly the ‘keys lookup’ sub-task (which validates locations against a model’s peril codes and coverage types), does not always benefit substantially from distribution. This is because the overall execution time for this stage is often dominated by sequential steps, such as generating and writing intermediate Oasis files, rather than the parallelizable lookup process itself.
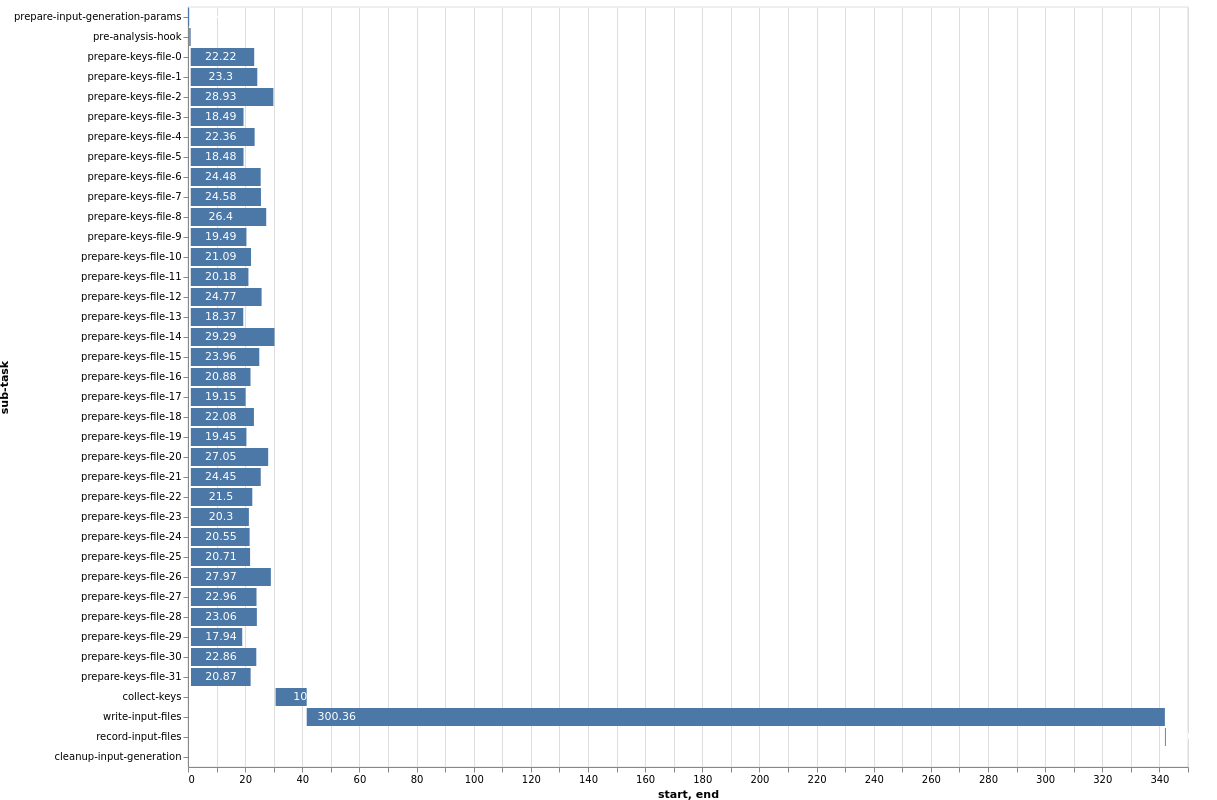
This Gantt chart illustrates an example where 32 ‘lookup chunks’ run concurrently, completing in approximately 25 seconds. However, the overall task duration is bottlenecked by the subsequent sequential step of generating and writing the intermediate Oasis files, which takes around 300 seconds. In this scenario, allocating more computational resources to the parallel lookup chunks would yield little to no overall speedup, as the un-distributed, sequential file writing becomes the dominant factor.
2. Losses Generation (e.g., generate-losses): Conversely, for the same model, the ‘losses generation’ stage typically exhibits the opposite pattern, where each ‘chunk’ is significantly more computationally intensive.
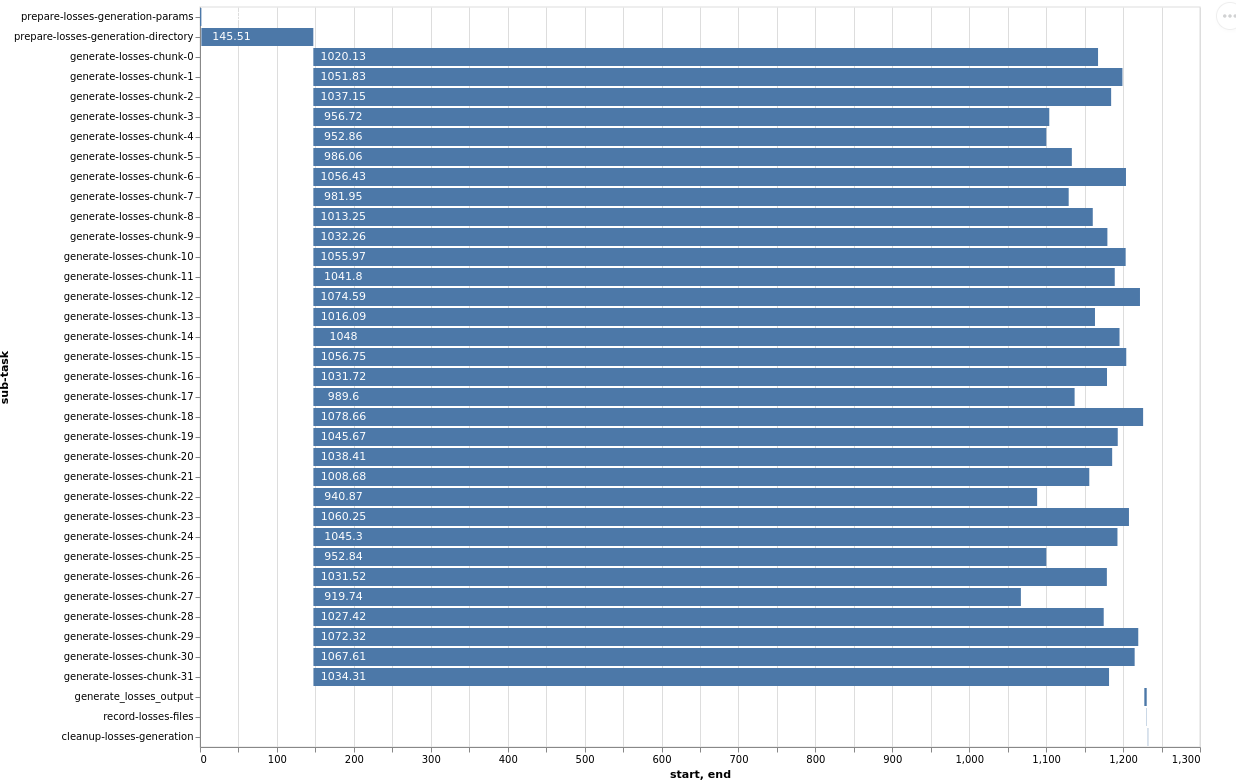
This Gantt chart for the losses generation stage demonstrates that the parallel ‘generate-losses-chunk’ sub-tasks represent the most substantial portion of the workload. Within each generate-losses-chunk sub-task, a single ktools data pipe executes:
eve <analysis chunk num> <total chunks> | <group up loss calculation> | <financial modules>
In this context, by adding more workers (and thus more CPU cores), we would very likely observe a substantial improvement in overall execution time. This is because the highly parallelizable loss calculation dominates the total time, and the sequential overhead is comparatively smaller.
However, the degree of speedup can still be influenced by the specific output reports requested in the analysis settings. The final aggregation and report generation, while following the parallel loss calculation, are inherently sequential steps. If highly complex or numerous output reports are requested, this final sequential phase might become a new bottleneck, limiting the overall speedup despite efficient parallel loss generation. Therefore, while more workers generally improve losses generation, the total execution time remains subject to the final sequential report processing.
Parallel Execution of Multiple Distributed Jobs
Each analysis (whether for input generation or loss generation) is assigned a priority value ranging from 1 to 10, with 10 being the highest priority. The default priority is 4 if none is explicitly specified.
Priority |
Comment |
|---|---|
10 |
The highest priority, ensuring immediate processing. |
8-9 |
Reserved for administrator-level control, used for critical workloads. |
4 |
Default priority for general analysis submissions. |
1 |
The lowest priority, for non-urgent or background tasks. |
Priority-Driven Task processing
When an analysis is initiated, every sub-task associated with that analysis inherits the analysis’s assigned priority. ‘Model workers’ within the same queue will then prioritize and consume tasks in descending order of priority.
In instances where multiple analyses share the same priority level, the queue reverts to a First-In, First-Out (FIFO) behavior. Tasks from the analysis that was submitted earliest will be processed before tasks from later-submitted analyses of the same priority.
Given sufficient compute resources across the worker cluster, it is entirely possible for multiple independent analyses to run concurrently. For example, if two analyses are each configured to process 16 ‘chunks’ (requiring 16 parallel sub-task slots each) and the system has a total of 32 cores available across its ‘model workers’, both analyses can run in parallel, with each consuming 16 of the available core slots.
Conversely, if the total available compute resources are limited, say to only 16 cores, and two analyses (each requiring 16 chunks) are submitted, the system will prioritize. The first analysis to be processed (based on priority and then FIFO) will consume all 16 available cores. The sub-tasks for the second analysis will remain queued until resources are released by the first analysis completing its distributed phase or individual chunks within it.
Broker-Level Queuing Behavior
It is important to note that this priority and queuing behavior is governed by the underlying message broker (e.g., RabbitMQ). Altering this specific queuing behavior would necessitate replacing or significantly reconfiguring the message broker, as it is not managed by the Oasis components themselves.
Sub-Tasks and Analysis Relationship
Sub-tasks are granular units of work that collectively form a complete analysis in the distributed workflow. Before an analysis execution is triggered, the analysis itself (represented as a resource in the REST API) will have no associated sub-tasks.
Sub-Task Creation and Tracking
When an ‘input generate’ or ‘losses run’ is initiated, the Oasis API, in conjunction with Celery, dynamically creates these sub-tasks. Each individual sub-task is then tracked as its own distinct resource within the REST API, accessible via the v2/analysis-task-statuses/{id}/ endpoint. As a sub-task progresses through its lifecycle in the Celery distributed system, its status is continuously updated in the Oasis API to reflect its current state (e.g., PENDING, QUEUED, STARTED, COMPLETED, ERROR).
Important Rerun Behavior
Warning: Triggering a rerun of an analysis (whether ‘input generate’ or ‘losses run’) has a side effect:
All previously existing sub-task resources associated with that analysis will be deleted from the Oasis API. Subsequently, a new set of sub-task resources will be created to track the state of the new execution run’s sub-tasks. This ensures a clean slate for each analysis attempt and prevents confusion with stale sub-task data, but also wipes any error or output logs attached to a sub-task resource.
Analysis Object Summary
Once sub-tasks are created and attached to an analysis, the primary analysis object in the API has several fields that provide a summarized view of its ongoing or completed execution:
status_count: This field provides a real-time summary of the number of sub-tasks in each possible state for the current analysis run. This is a high-level indicator of the analysis’s progress and health.
Example JSON:
"status_count": {
    "TOTAL_IN_QUEUE": 0,
    "TOTAL": 6,
    "PENDING": 0,
    "QUEUED": 0,
    "STARTED": 0,
    "COMPLETED": 6,
    "CANCELLED": 0,
    "ERROR": 0
}
Analysis_chunks: This field stores the configured number of ‘lookup chunks’ (or input generation chunks) that were assigned for the most recently triggered analysis run. This directly corresponds to the degree of parallelism for the input generation phase.
Lookup_chunks: This field stores the configured number of ‘event chunks’ (or loss generation chunks) that were assigned for the most recently triggered analysis run. This directly corresponds to the degree of parallelism for the loss generation phase.
sub_task_count: This field represents the total count of all individual sub-tasks generated for the last triggered run of the analysis. It is the sum of all sequential sub-tasks and all parallel chunks (as defined by analysis_chunks and lookup_chunks). This gives a precise count of the granular tasks that comprise the complete workflow.
Detailed Sub-Task List
For a comprehensive view of all individual Sub-Task Resource objects attached to a specific analysis, a dedicated API endpoint is available:
GET v2/analyses/{id}/sub_task_list/
Calling this endpoint will return a detailed list of all Sub-Task Resource JSON objects, allowing for in-depth inspection of each task’s status, logs, and timing.
Oasis Sub-Task Resource Fields
This JSON object represents the status and metadata for a single sub-task within an Oasis analysis workflow, designed to track its execution via Celery.
Field |
Type |
Description |
|---|---|---|
id |
Integer |
The primary key and unique identifier for the sub-task within the Oasis API. |
Task_id |
String (UUID) |
The unique identifier assigned by Celery to the actual asynchronous task. |
status |
String |
Indicates the current state or final outcome of the Celery task. Possible values include: PENDING, QUEUED, STARTED, COMPLETED, ERROR, CANCELLED. |
Queue_name |
String |
The name of the Celery queue to which this sub-task was assigned. Specifies the target model worker group (e.g., “OasisLMF-PiWind-v2-v2” for the PiWind model, v2 mode). |
Name |
String |
A human-readable, descriptive name for the sub-task, providing context about its specific operation within the workflow (e.g., “Prepare losses generation params”). |
slug |
String |
A URL-friendly, short, hyphenated version of the Name. Often serves as a programmatic identifier for the sub-task type, useful for routing or internal references. |
pending_time |
Datetime (ISO 8601) |
The timestamp (in UTC) when the sub-task was initially created and registered in the Oasis system as PENDING, marking its first appearance to the system. |
queue_time |
Datetime (ISO 8601) or null |
The timestamp (in UTC) when the sub-task was placed onto the Celery queue by the TaskController. Can be null if the transition to STARTED was rapid or not explicitly captured for all task types. |
start_time |
Datetime (ISO 8601) |
The timestamp (in UTC) when the Celery worker picked up the task from the queue and began its execution. Marks the start of active processing. |
end_time |
Datetime (ISO 8601) |
The timestamp (in UTC) when the Celery task completed its execution, regardless of success or failure. The duration of execution is end_time - start_time. |
output_log |
String (URL) |
A URL endpoint to retrieve standard output (stdout) logs generated by the sub-task. Essential for understanding task execution details and debugging. |
error_log |
String (URL) or null |
A URL endpoint to retrieve standard error (stderr) logs. Crucial for debugging when status is ERROR. Will be null if the task completed successfully. |
retry_log |
String (URL) or null |
A URL endpoint to access logs specifically related to any retry attempts of this sub-task. Provides details about each retry. null if no retries occurred or were configured. |
retry_count |
Integer |
The number of times this sub-task has been re-attempted after an initial failure. Increments with each retry, capped by the configured maximum. 0 indicates success on the first attempt or no retries yet. |
Sub-Tasks and Celery Revocation
In Celery, task revocation is a mechanism used to cancel or prevent the execution of a task. If a worker is currently processing a revoked task then a SIGTERM is triggered, this signal kills the process mid flow. Any tasks not picked up by a worker will be removed from the model queue.
Celery Task revocation is initiated under two conditions:
Maximum Retry Threshold Reached: If any individual sub-task within a Celery chain fails past its configured retry attempts (e.g., typically after the 3rd consecutive failure by default), the system will trigger a full workflow cancellation.
Explicit Analysis Cancellation: A cancellation request made to the Oasis API endpoint (POST analyses/{id}/cancel/) will immediately trigger the revocation process for all active sub-tasks associated with that analysis. This allows for manual intervention to stop ongoing analyses.
Revocation Process and State Transitions
When either of the above conditions is met, the system instructs the Celery broker to revoke all currently active sub-tasks belonging to that analysis. Specifically, any sub-task found in one of the following intermediate states will be targeted for revocation:
PENDING: Tasks that have been registered but not yet submitted to a worker.
QUEUED: Tasks that have been placed in a worker queue, awaiting processing.
STARTED: Tasks that are currently being executed by a worker.
Upon successful revocation, the status of these targeted sub-tasks is updated to CANCELLED. This provides a clear indication that the task was halted by an external command rather than completing naturally or failing on its own.
Handling the Failing Task
A sub-task that failed its 3rd (or max configured) attempt will have its status set to ERROR. This reflects that it was the point of failure that initiated the overall cancellation. All other related sub-tasks that were in progress or pending will transition to CANCELLED.
Traceback File Generation for Debugging
To aid in post-mortem analysis and debugging of cancelled or failed runs, the system aggregates relevant output logs from all sub-tasks and stores them in a consolidated traceback file. This provides a centralized resource for understanding why an analysis did not complete as expected:
For a failed or cancelled input generation run (run_mode = v2 file preparation), the aggregated logs are stored and accessible via the API at: analyses/{id}/input_generation_traceback_file
For a failed or cancelled losses generation run (run_mode = v2 losses generation), the aggregated logs are stored and accessible via the API at: analyses/{id}/run_traceback_file
Input Generation Sub-tasks
This section outlines the individual sub-tasks involved in the ‘Input Generation’ workflow. While the overall structure and presence of these sub-tasks are consistent across all v2 runs, the specific computations or actions performed within each task can vary based on the Oasis model and its configuration. For instance, a pre-analysis-hook task will always be part of the workflow chain, but for models that do not implement custom logic for this hook, it will effectively be a No-Operation (NO-OP) and be skipped over. Conversely, other models might use this hook to perform exposure disaggregation or data adjustments before proceeding to the keys lookup steps.
Workflow Parameters (params and kwargs)
A key aspect of how these sub-tasks operate is through the passing of configuration and runtime parameters.
params Dictionary: The prepare-input-generation-params sub-task is responsible for collecting all relevant run configuration data. This data is sourced from multiple locations including:
model_settings.json (model-specific configurations)
Analysis settings provided by the user (via the API)
OasisLMF package and default settings
All these settings are consolidated into a single dictionary object (named params). This dictionary is then passed as an argument from one sub-task to the next throughout the entire workflow execution. This ensures that every sub-task has access to all the necessary configuration to perform its part of the analysis. For detailed debugging, setting the environment variable OASIS_DEBUG=True will log the exact params dictionary used for each sub-task’s execution.
// Example 'params' dictionary (excerpt, as it can be very large)
{
  "copy_model_data": false,
  "kernel_num_processes": -1,
  "verbose": true,
  "gulmc_effective_damageability": false,
  "lecpy": false,
  "model_run_dir": "/tmp/run/analysis-1_losses-416c11d653ef4ab485cbf1a5d7ac0c82/run-data",
  "chunk_log_location": "analysis-1_losses-416c11d653ef4ab485cbf1a5d7ac0c82/log-1.tar.gz",
  "results_path": "/tmp/run/analysis-1_losses-416c11d653ef4ab485cbf1a5d7ac0c82/results-data",
  // ... many more configuration parameters ...
  // ... further parameters ...
  "analysis_settings_json": "/tmp/run/analysis-1_losses-416c11d653ef4ab485cbf1a5d7ac0c82/analysis_settings.json",
  "model_storage_json": null,
  "kernel_alloc_rule_ri": 3,
  "storage_subdir": "analysis-1_losses-416c11d653ef4ab485cbf1a5d7ac0c82",
  "output_location": "39f2b14528ec4d59bf129f58f453c57b.tar.gz"
}
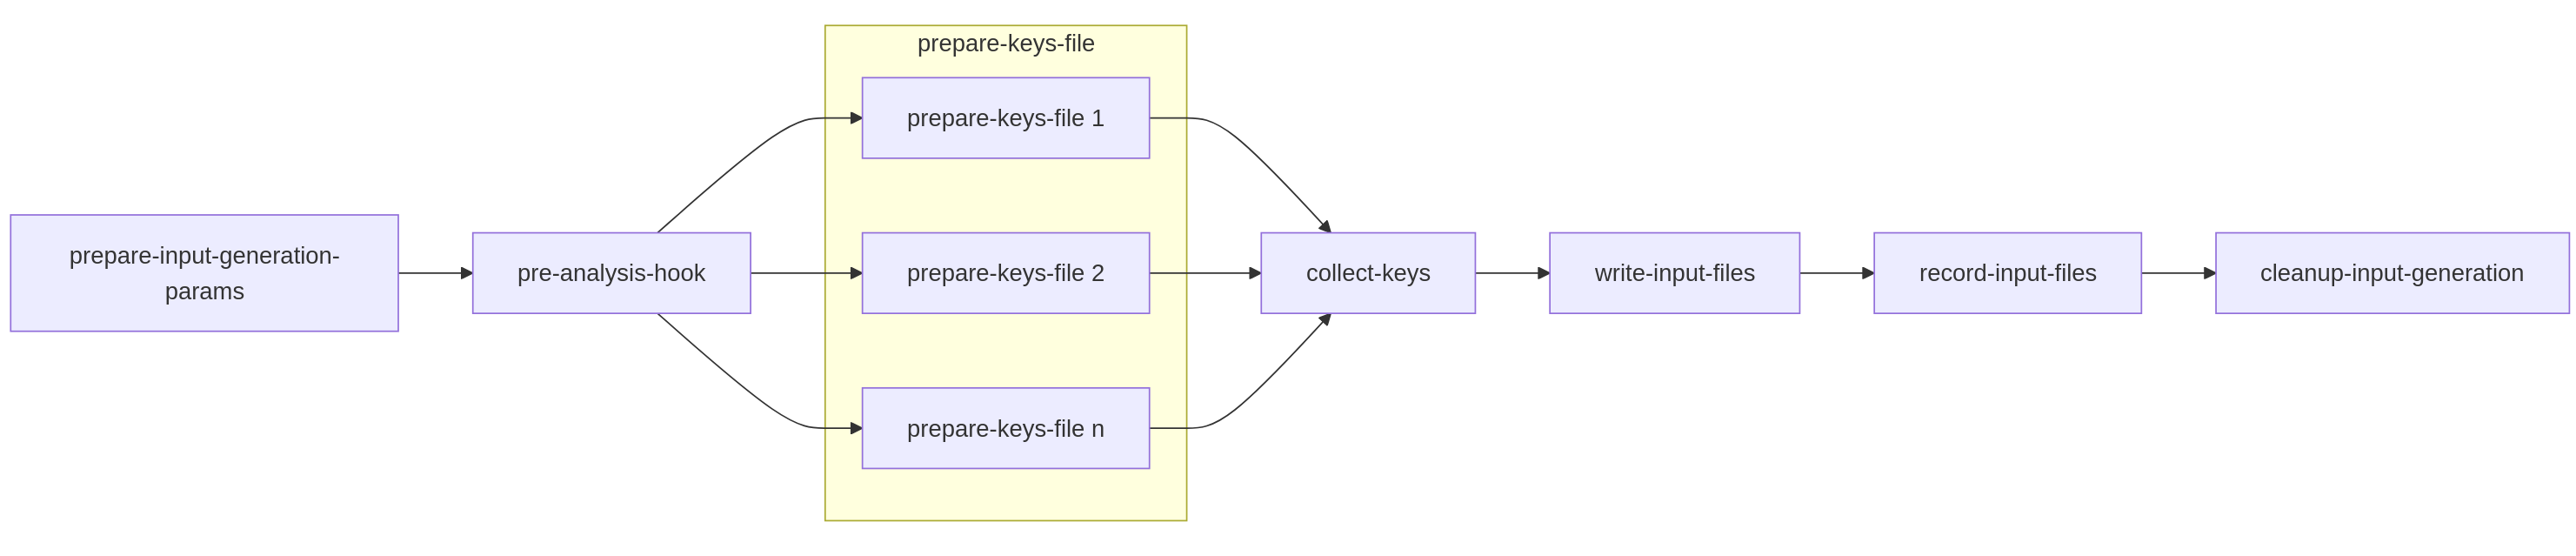
Specific Sub-Tasks in the Input Generation Workflow
The following outlines the sequence and purpose of each sub-task in the input generation chain:
Prepare-input-generation-params:
Purpose: This initial sequential task is responsible for consolidating all relevant configuration and runtime parameters into the params dictionary. It gathers settings from model defaults, model_settings.json, and user-provided analysis settings, ensuring a consistent and complete set of parameters is available for subsequent tasks.
Role in Workflow: This task is the starting point for parameter propagation across the entire chain.
Pre-analysis-hook:
Purpose: This is a designated extension point where model suppliers can inject custom code to perform modifications or adjustments to the exposure data (OED - Open Exposure Data) before it is used in the core keys lookup and file generation stages. This can involve operations like exposure disaggregation, data cleaning, or other preparatory steps.
Input: Primarily the four core OED exposure inputs (location, accounts, reinsurance files).
Prepare-keys-file <n> (Parallel Section):
Purpose: This represents the parallelizable section of the input generation. Based on the lookup_chunks configuration, the overall location file (a primary OED input) is logically sliced into N parts. Each Prepare-keys-file sub-task (where <n> denotes the chunk number, e.g., Prepare-keys-file 1, Prepare-keys-file 2, etc.) then performs a ‘keys lookup’ operation on its assigned subset of locations. For instance, if a location file has 100,000 entries and 10 chunks are set, each of these 10 parallel tasks will process approximately 10,000 locations.
Role in Workflow: These tasks run concurrently across available workers, significantly accelerating the process of mapping locations to model-specific internal IDs and perils.
Output: Each task generates partial keys results and potentially partial error logs for its specific chunk. These are stored in the shared storage medium as documented in “Results Caching.”
Collect-keys (Callback Task):
Purpose: This is the aggregation (callback) task that executes only after all Prepare-keys-file <n> sub-tasks have successfully completed. It collects all the partial keys results (e.g., .tar.gz files containing individual lookup-X.tar.gz) and error reports from each parallel chunk.
Output: It then consolidates these into a single, comprehensive keys.csv file and a keys-errors.csv file, making the complete keys lookup results available for the next sequential stage.
Write-input-files:
Purpose: This sequential task is responsible for generating the final Oasis input files (e.g., items.csv, coverages.csv, fm files etc.) required by the ktools framework for loss calculation. This step is conceptually similar to the functionality provided by the MDK’s oasislmf model generate-oasis-files command.
Input: Crucially, this task receives the consolidated keys lookup results (keys.csv, keys-errors.csv) and the prepared params dictionary as inputs from the preceding sub-tasks in the chain. It does not perform its own Pre-analysis-hook or keys lookup; these are prerequisites fulfilled by earlier sub-tasks.
Record-input-files:
Purpose: This task typically runs on a dedicated ‘worker-monitor’ type container or interacts directly with the API server. Its role is to take the final generated Oasis input files and their metadata, and persist them into the Oasis API server’s storage system. This makes the generated inputs accessible for subsequent loss generation runs or for review.
Cleanup-input-generation:
Purpose: This is the final house-keeping task in the chain. It is responsible for removing any temporary files, directories, or stored partial results that were created during the input generation process across the shared storage medium.
Conditional Deletion: As previously noted, this cleanup can be bypassed for debugging purposes by setting the OASIS_KEEP_REMOTE_DATA=True environment variable.
Losses Generation Sub-tasks
The ‘Losses Generation’ workflow follows a similar chain of sub-tasks to the ‘Input Generation’ process. However, parallel section is focused on the core on ktools (or pytools) execution, rather than a keys lookup.
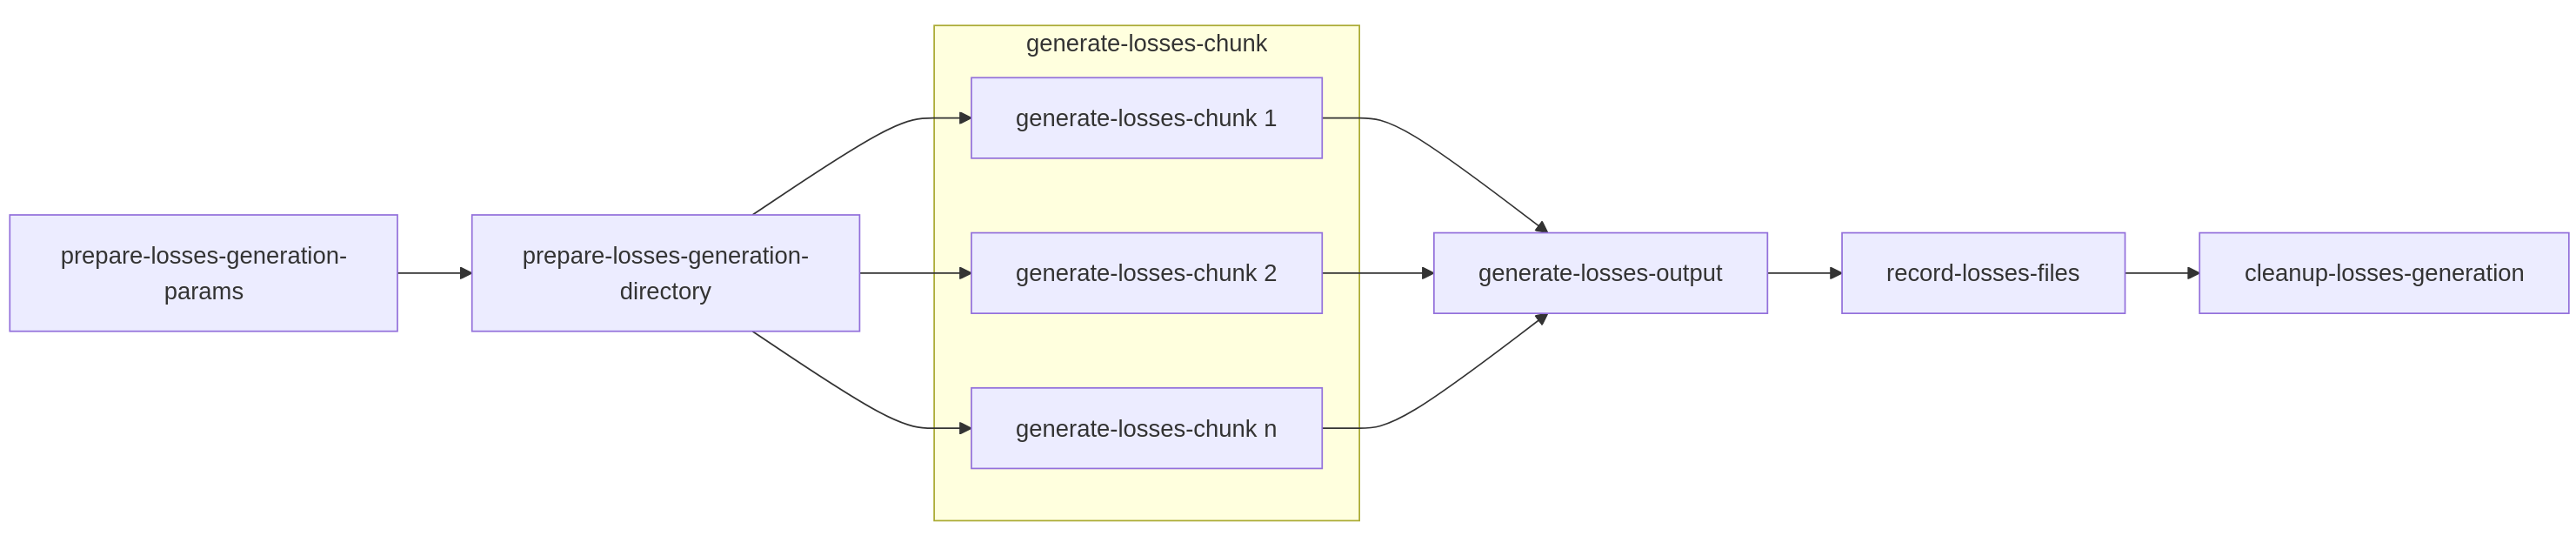
Specific Sub-Tasks in the Losses Generation Workflow
The following outlines the sequence and purpose of each sub-task in the losses generation chain:
Prepare-losses-generation-params:
Purpose: This initial sequential task is identical in format and purpose to its counterpart in the ‘Input Generation’ workflow. It’s responsible for consolidating all relevant run configuration data into a single params Python dictionary object. This includes settings from model_settings.json, analysis settings, and system defaults, making them accessible to every subsequent sub-task in the chain.
Prepare-losses-generation-directory:
Purpose: This setup task takes the input.tar.gz file (which is the consolidated output from the ‘Input Generation’ phase) and unpacks it into a structured directory. This directory is then prepared as the full “run directory” ready for the main ktools / pytools execution. Additional preparatory steps performed here include:
Generating necessary Financial Module (FM) file structures.
Symbolically linking or copying relevant model data files from the worker’s local model cache.
Downloading any user-supplied data files specific to this analysis.
Persistence: Once this “execution-ready” directory is assembled, it is then archived (e.g., into a .tar.gz) and stored in the shared storage. The archiving is vital for distributed execution: if a fresh worker is assigned a losses execution chunk (e.g., due to task routing or retries), it can simply fetch and extract this pre-prepared archived run directory, ensuring it has all necessary files to begin processing without re-running the setup steps.
generate-losses-chunk (Parallel Section):
Purpose: This is the core, highly parallelizable kernel execution step for losses generation.
Internal Process: As described previously in “Optimizing Throughput,” each chunk typically executes a single ktools data pipe: eve <analysis chunk num> <total chunks> | <group up loss calculation> | <financial modules>.
Output: The partial results from each generate-losses-chunk are stored in the shared storage medium, typically in archives named work-{chunk_number}.tar.gz. Additionally, execution logs specific to each chunk are stored under log-{chunk_number}.tar.gz, aiding in debugging.
Generate-losses-output (Callback Task):
Purpose: This is the aggregation (callback) task that executes only after all parallel generate-losses-chunk sub-tasks have successfully completed and stored their partial results. It collects all the work-{chunk_number}.tar.gz archives from the shared storage and extracts them into a single, consolidated run directory on a single worker.
Output Report Generation: Once all partial results are staged, a single bash script, run_outputs.sh, is executed. This script is similar to the v1 run’s output reporting phase but is specifically configured to take the aggregated output from the previous parallel step and run only the necessary output reporting tools (e.g., summarycalc, leccalc, aalcalc) to create the final analysis reports. These final reports are then archived into a single output.tar.gz.
Record-losses-files:
Purpose: This task typically runs on the v2-worker-monitor. Its role is to take the final output.tar.gz containing the aggregated loss reports and persist it into the Oasis API server’s storage system. This makes the final analysis results accessible for download, review, or integration with other systems.
Cleanup-losses-generation:
Purpose: This is the final house-keeping task in the chain. It is responsible for systematically removing any temporary files, directories, or stored partial results (work-{chunk_number}.tar.gz, log-{chunk_number}.tar.gz, and the unpacked run directories) that were created during the losses generation process across the shared storage medium.
Conditional Deletion: As previously noted, this cleanup can be bypassed for debugging purposes by setting the OASIS_KEEP_REMOTE_DATA=True environment variable.